We are extremely excited to announce the General Availability of vRealize Operations 8.2 and vRealize Operations Cloud.
vRealize Operations delivers self-driving IT operations management for private, hybrid, and multi-cloud environments. Not only does it offer a unified monitoring platform for everything on-premises and off, it also provides a single monitoring console for all your VM- and container-based workloads.
With that vision in mind, the latest release in vRealize Operations – both on-prem and SaaS editions – forges ahead with four primary release themes:
- Application-aware troubleshooting
- Kubernetes
- Extensibility
- Ease of use
Application-Aware Troubleshooting
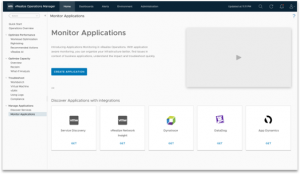
APM Integrations in vRealize Operations Cloud
Customers using the most popular Application Performance Management (APM) tools on the market can now hook those tools up to vRealize Operations and discover the apps being monitored by those tools, then pull in data from those applications to vRealize Operations.
Of course, app teams are typically the primary users for APM tools, whereas vRealize Operations is typically best suited for infra teams. However, infra and ops admins can do their jobs better if they have full line of sight visibility into the applications their infrastructure is supporting.
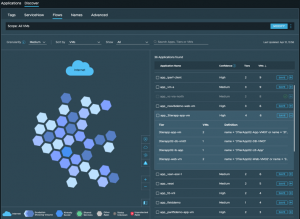
App Discovery in vRealize Network Insight
Another way we are making applications a first-class citizen within vRealize Operations is by continuing to build out our application discovery story.
As we continue building integrations between vRealize Operations and vRealize Network Insight, pulling apps discovered by vRealize Network Insight into vRealize Operations was a natural progression.
vRealize Operations is very good at discovering “packaged” apps, but vRealize Network Insight is also able to map network dependencies and determine what constitutes an application. Users who have both vRealize Operations and vRealize Network Insight can now pull those constructs and discoveries into vRealize Operations for a more holistic “map” of the applications running in their environment.
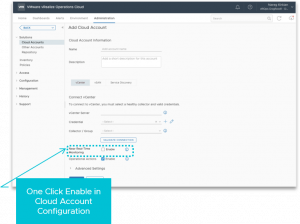
Near Real-Time Monitoring in vRealize Operations Cloud
The other huge update for vRealize Operations Cloud that will allow more granular, precise troubleshooting than ever is that of near real-time monitoring. Customers will now have the option to turn this feature on for 15x more regular data collection.
Kubernetes
There are a couple big updates around Kubernetes monitoring in vRealize Operations in the 8.2 release.
First, vRealize Operations will now have auto-discovery for Tanzu Kubernetes guest clusters (in addition to its current monitoring capabilities).
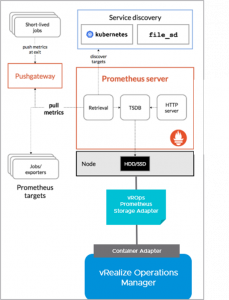
Prometheus Support in vRealize Operations 8.2
Second, vRealize Operations will integrate with Prometheus via an adapter. This adapter will simply take the data being sent to it and forward it to vRealize Operations.
Finally, we will be rebranding the Management Pack for Container Monitoring to the “Management Pack for Kubernetes” – same great monitoring for all your Kubernetes clusters, just with a brand new name!
Extensibility
Management Pack Updates
First, the Management Pack for AWS now includes capacity analytics for EC2, so vRealize Operations users can evaluate what sort of capacity utilization they’re getting out of the AWS resources they’re paying for.
Among the Management Pack updates for VxRail are 140 new alerts (from 65 in the last release to 205 in this one).
There are also updates to the management packs for SNMP, NSX-T, and Skyline.
We are also introducing a new management pack for Flowgate, which aims to bring facility awareness into IT management systems and better inform IT operations management on high availability, cost savings and improved sustainability, with more information on power, cooling, environment, and security.
Additionally, we now have a vRealize Operations Cloud-exclusive management pack for Horizon.

vRealize True Visibility Suite
Then, of course, we acquired True Visibility Suite from Blue Medora and are now calling it vRealize True Visibility Suite. This is huge for our extensibility journey!
Ease of Use
Integrated Policy Workflows
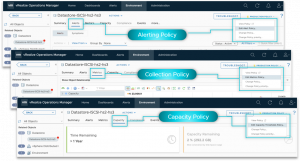
One ease-of-use area that has been reconstructed in 8.2 is that of policy management, which is now better integrated into existing workflows. So from an object summary page – for example, the datastore shown here – you can go to the different functions, like alerts/metrics/capacity, and launch straight into (1) viewing and/or editing the policy associated with that object, or (2) assigning a new policy – all in context of the specific object page you’re viewing.
Then, once you DO decide to create or update a policy, there will be simplified workflows in place for that process. The new approach will add a streamlined organization and flow to policy management.

New Dashboard Getting Started Page
The Dashboard Getting Started page has also been redesigned to (1) better show relationships, and (2) have a clearer use case-based flow.
The reason for this is to provide easier, more intuitive navigation and better show relationships between objects and workflows. So, you can see below how this idea of “relationships” will be manifested if you were to click on the “Troubleshooting” workflow. From here, dashboards will be organized around the specific type of troubleshooting (availability, contention, utilization, config), and type of object.

New Dashboard Organization Workflow
Other Goods
The highlights previewed above are far from comprehensive – vRealize Operations 8.2 has a gargantuan payload. Here’s a sampling of the best of the rest:
- vRealize Automation integration (Cloud and 8.2)
- Workload optimization potential (see what sort of optimization you could achieve across multiple clusters by running workload placement actions)
- Downloadable workload optimization reports
- Pricing support for ALL workloads (not just vRealize Automation workloads!) with customizable rate cards
- Daily VM costing granularity to match existing methodology for pricing
- Improvements in the pricing and costing engine
- AWS CloudWatch API guest OS metrics
- Expanded scope of metric correlation
- New object summary pages for vSAN
- Simplified content and configuration, including importable/exportable content (alert definitions, custom groups, dashboards, policies, super metrics, etc)
- Custom compliance templates in vRealize Operations Cloud
- Cloud Director Service support in vRealize Operations Cloud
- Geo expansion (new Sydney region) for vRealize Operations Cloud
- vRealize Operations Cloud now on VMware Cloud Provider Hub
For More Information…
- Read the technical GA blog
- Revisit vRealize Operations at VMworld
- Try the vRealize Operations 8.2 Lightning Lab
- Try a vRealize Operations Cloud free trial
- Check out the new vRealize True Visibility Suite
- See how to get 50% off


